Ordinary Differential Equations in Python
A simple python script to solve, fit and analyze ordinary differential equation (ODE) models
Used to explain planetary movement, disease spreading, reaction kinetics just to name some examples. Differential equations are one of the most useful mathematical technique to model natural phenomena. A key part shared among differential equation models are the parameters that manage to control the behavior of the model. Those parameters can be approximated by a regression technique, using measurements of the appropriated natural phenomena. If the structure of the model can be known (the differential equation has an analytic solution) the regression problem can be easier to solve. However, some differential equation models don’t have an analytic solution, which results in the use of numerical methods to obtain an approximated solution. The following describes a python script to solve, fit and analyze a simple ordinary differential equation (ODE) model.
Defining and solving the model
As radioactive decay was my introduction to ODE modeling, I’m going to use it as an example (as my first post, I think kind of fit the theme). Radioactive decay is given by the ODE:

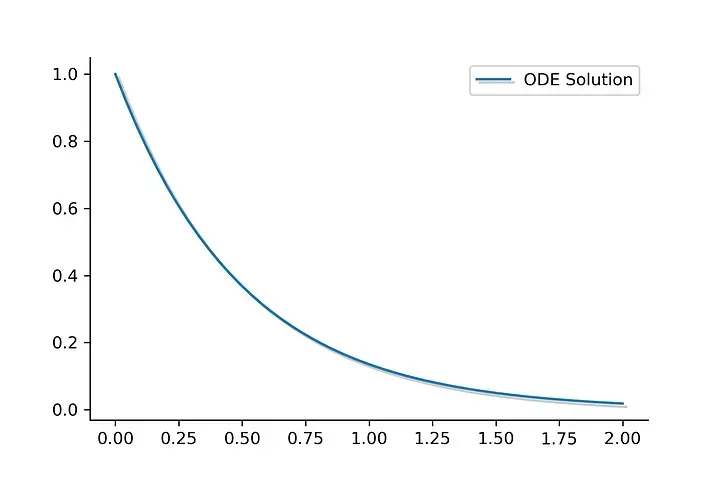
Where C is the amount of radioactive material and k is a positive material dependent constant. To solve that ODE, we need: create a function that calculates the right side of the equation, an array that contains the integration times, and the odeint function from scipy. Using the initial condition C0=0, and k=2, and solve the equation we get a curve like this.
Parameter estimation
Once we know how to numerically solve an ODE, we use the curve_fit function (also from scipy) to estimate. First, to generate some data, we add a uniform random number to the obtained solution. That will give us a data set to work with. Then just call the curve_fit function to estimate k, plotting the results we get a curve as follows.

Ideally, we’ll be working with experimental data, however as we are working with simulated data, we can explore some other aspects of ODE modeling.
Data size and parameter estimation error
Data acquisition is usually constrained by several factors that can diminish the number of data points that we are able to obtain. We can evaluate the impact of data acquisition by changing the number of data points that we generate. Using a similar strategy as described above we can observe that the absolute error of the estimation is around the same between 1000, 500,100, and 50 data points.

Residuals analysis
We already observe that with around 50 data points the estimation error converges to a minimum value. To determinate if the model correctly describes the data, we can perform a residual analysis. A residual is defined as the difference between the data and the regression model, and as we are working with simulated data, we should be able to get the same random noise that we add.
By its shape residuals can also tell us if the model lacks some terms. Adding a linear or a periodic term to the simulated data, residuals correctly reconstruct the provided term. Allowing us to make changes to the model based on the residuals, or to adjust the data acquisition


Concluding remarks
As described above, we already know how to solve and fit a simple ODE model, and some analysis techniques that can be applied to analyze any regression model. The complete code of this tutorial can be found at my GitHub by clicking here. And in the next installment of this series, I will show you how to solve and fit an ODE system using python, and some other analysis tools.
